Over the past 2 weeks, we published part one and part two of our Beginner’s Guide to Online Video Marketing. If you haven’t read them yet, make sure to start there!
Video made: check. Optimized: check. Uploaded: check. Where do you go from here?
If you’ve done any kind of marketing in the past, you know the job is never finished until you’ve measured the ROI of your ads. Entire industries have been built on tracking market response to brochures, ads and direct marketing pieces. Wouldn’t it be nice to know how well your commercial video production does the job of selling you?
That’s where video analytics comes into play. Video analytics, often provided by video hosts (like Wistia or YouTube), can help you fine-tune your message, sharpen your video’s focus and ensure that it’s reaching the market you want to reach.
How Do I Know Who’s Watching My Video?
When you post articles, blog post and other content, you have the benefit of web page statistics and analytics to help measure its performance. Web page statistics like referring links, clicks and bounce rates can tell you a lot about the performance of your marketing and ads as well as help you fine-tune your on-page content and SEO.
While you can certainly track the number of people who click on a web page with your marketing video, it’s not as easy to tell if someone actually clicked play to watch it. Video analytics can help you measure the impact of your videos, troubleshoot problems and hone your message to reach exactly the target audience you want.
Finding the Goodies on YouTube Analytics
Most video hosting services provide you with an incredible amount of information about who is viewing your videos, where they’re watching them and how they’re sharing them. YouTube is no exception, but many people never venture past the number of views, likes and dislikes their videos receive. In fact, many people don’t even know where to find the information. There are a couple of different ways to dig into your video stats and video analytics on YouTube.
Access the Statistics from the Video Player
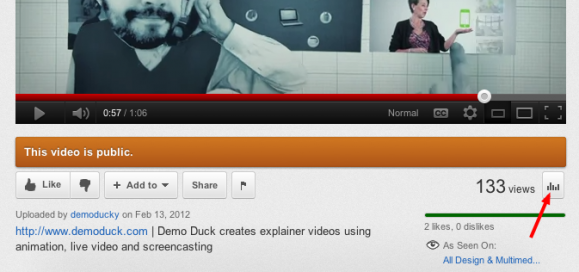
Click on the little graph icon in the Share bar of any individual icon to open the publicly available video statistics.

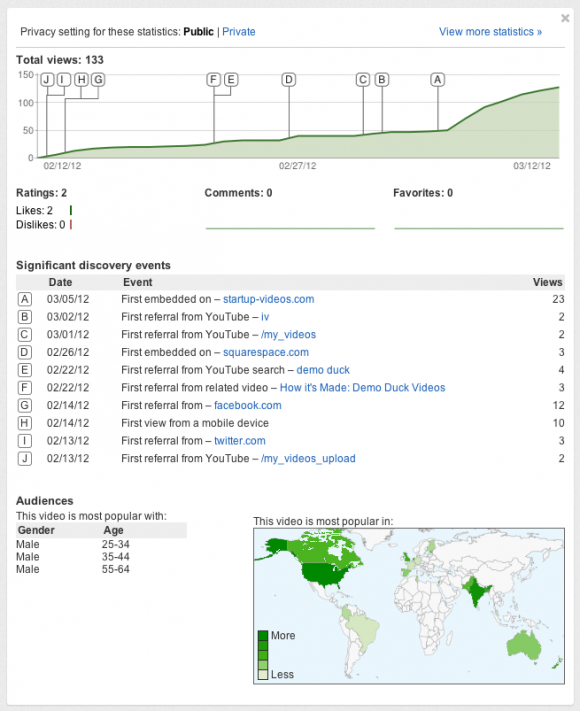
You’ll get an overview of a number of important factors that looks like this:

As you can see, there’s quite a bit of information even on the preliminary overview page. One of the most important pieces of information here is the keywords used to discover your video, listed under “First referral from YouTube search”. It’s a good way to figure out if you’ve optimized your video for the right keywords.
SEO Video Marketing Tip: The information on this page is publicly available. That means you can access this same information on videos posted by your competitors, a good way to check out the keyword phrases and strategies that are working for your top competition.
Diving Into Analytics
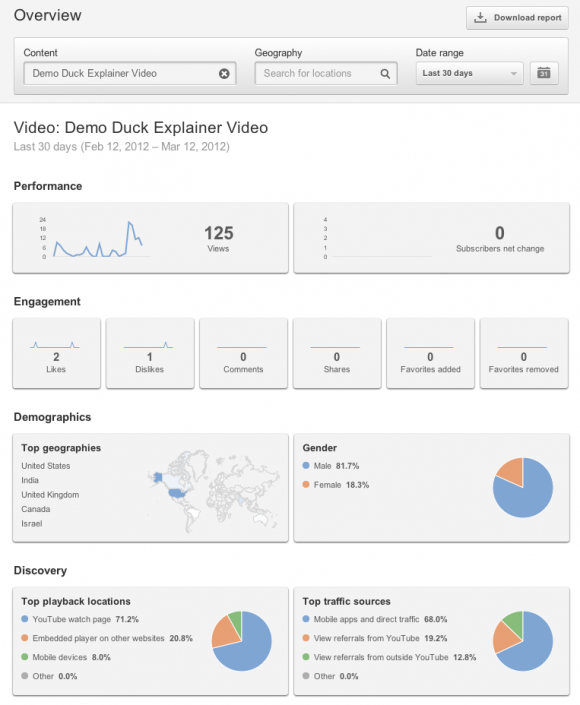
Want more information? Click on the “View more statistics” link at the top of the chart to open up the analytics for your video. The overview looks like this:

As you can see, the analytics overview gives you a great breakdown of performance, engagement, demographics and discovery. In a nutshell, here’s what each of those can tell you.
- Performance – How many people have watched your video and when did they watch it.
- Engagement – How many people liked, disliked, favorited, shared and commented on your video.
- Demographics – In which geographical areas is your video most popular. What ages and genders of people are watching it.
- Discovery – How are people finding your marketing video and where are they watching it.
Each of the sections links to a page that gives very granular details. Under Demographics, for example, you can click on a country or state to get the statistics on views from just those areas broken down by date. That’s great information to know if you’re trying to reach a local market or you’re aiming for a teen market but drawing 40 year old viewers.
But Are They Watching It? Measuring Audience Reactions
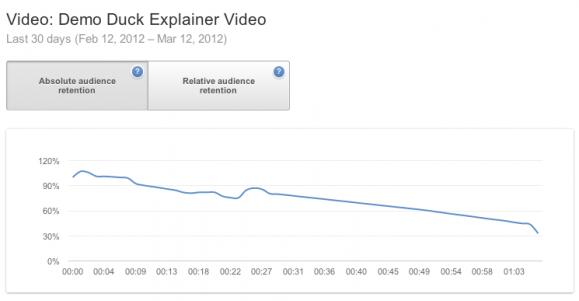
One of the most important and overlooked pieces of information you’ll find in your video analytics is the engagement graph. On YouTube, it looks like this:

The engagement graph – YouTube calls it an “audience retention graph” – measures viewing behavior for each second of your video. It tells you what percentage of viewers is still watching your video at each second along the way.
You’ll notice along the left side that the percentages go up above 100 percent. That’s to account for people who rewound the video to watch a part of it again. In fact, any time you see the graph line rise instead of dropping, it means that some of your viewers are going back to watch a portion again.
By watching the video as you view the chart, you’ll be able to tell exactly where you’re losing your audience – or where you’ve especially engaged them. That information can help you fine-tune your marketing video to make sure that the message you want to send is the message that’s being received.
Other video hosts provide similar analytics that can help you measure the effects of your marketing videos. Get conversant with the video analytics provided by your video host and watch your marketing efforts pay off in increased views and increased leads.