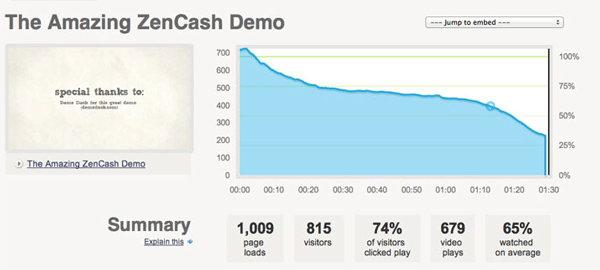
We recently received some great news from a client of ours. Their video is being watched and with a high amount of viewer interest, and we’ve got the data to prove it!

What we can see from this chart is that 815 people viewed the page with the video on it (some more than once), and 74% of them clicked the play button. On average a viewer watched 65% of the video. These numbers are pretty impressive. When compared to some data released by KISSMetrics and Wistia (which I’ve linked to and will talk about more below), it’s far above the average. Part of this may have to do with how the video is displayed.
Subscribe to Demo Duck Monthly
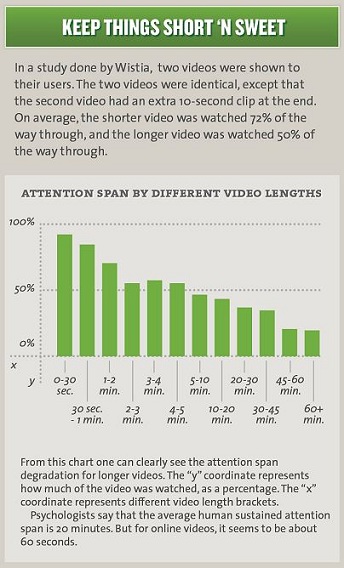
On ZenCash’s website you’ll notice that there is little else to interact with beside the video, that will increase viewership rates. To give a comparison, Demo Duck has a homepage video explaining what we do, and otherwise singing our praises, but it has a much lower viewership rate. The reason is that you go to that page almost every time you visit the site, but probably have only watched the video once. This isn’t to say that the comparrison between page and video loads is the most important factor though. Once someone is watching your video, you want them to finish it, or at least get all the important bits. To get an idea of how video performs on average on more than just ZenCash’s website here is a beautifully put together graphic from KISSMetrics with data from Wistia.
The main points of the graphic:
- Keep your video short and sweet.
- Put the best/most important material in the beginning.
- Make your video specific and personal for the audience.
- Short videos engage viewers better.
- Keep data, it helps analyze a video and how you’re using it.
The tips provided there suggest one piece of advice I would like to draw attention to here as well: Keep it Short and Sweet (KISS), something we’d suggested in a previous blog post as well. Video is an excellent way to get your idea across to potential customers, but only if they watch. The graph below shows how attention span changes with the increasing length of a video.

When you’re thinking about a video for your website, remember: KISS. You can see in the graph above that the percentage of a video watched is dependent on the total video length. One thing I’d point out it the rather steep drop between a video 1-2 minutes long and 2-3 minutes long. It pays off to have a short and concise video.
Let’s compare some Wistia figures in the KISSMetrics graphic from earlier:


This data shows that when accounting for all page views, our number may seem low. When considering only those loads of first time visitors, we see a significant increase in play rate. It almost doubles!
The last thing I’ll pull from our now familiar graphic is this simple reminder towards the end. Understand your audience. Every presentation takes this into account, so your online video should as well. Make sure your videos are placed strategically around your site to be found by the viewers who they apply to.
