NOTE: this post is originally from 2012, so the work samples included, and statistics are from that era. However, the processes and tips are still relevant. To see more recent work from our team, check out our portfolio.
Once you spend the time and money to produce a video, it’s important to have a plan in place to track the results. Being able to present your team (and your boss) with proof that your video was a good investment can help you secure the budget you need for additional videos and give you leverage for that raise or promotion you’ve been gunning for.
Sure, types of video content—and where its shared—may change over the years. Perhaps it's short, funny videos on TikTok. Or 3D videos that demonstrate how a new product works. But most marketing videos have some type of goal—and tracking the ROI can help you establish its value.
Here are 3 simple steps that can help you track video ROI, performance, and impact.
Step 1: Define the Goal
You most likely had a good reason for creating a video, like helping people better understand your product or service, increasing call-ins, quote requests or sign-ups on your website, or generating more revenue through your e-commerce store. Whatever the reason, it’s important to clearly define it before producing and launching your video.
In the case of the Demo Duck homepage video, aka our "reel," our goal was twofold: help visitors understand our variety of capabilities and increase the number of visitors requesting a quote.
Step 2: Use the Right Tools
Once you have a clear goal, you need to make sure you have the right tools in place to track the results when you launch. For video, this means your video host (like YouTube or Wistia) and your website analytics provider (Google Analytics).
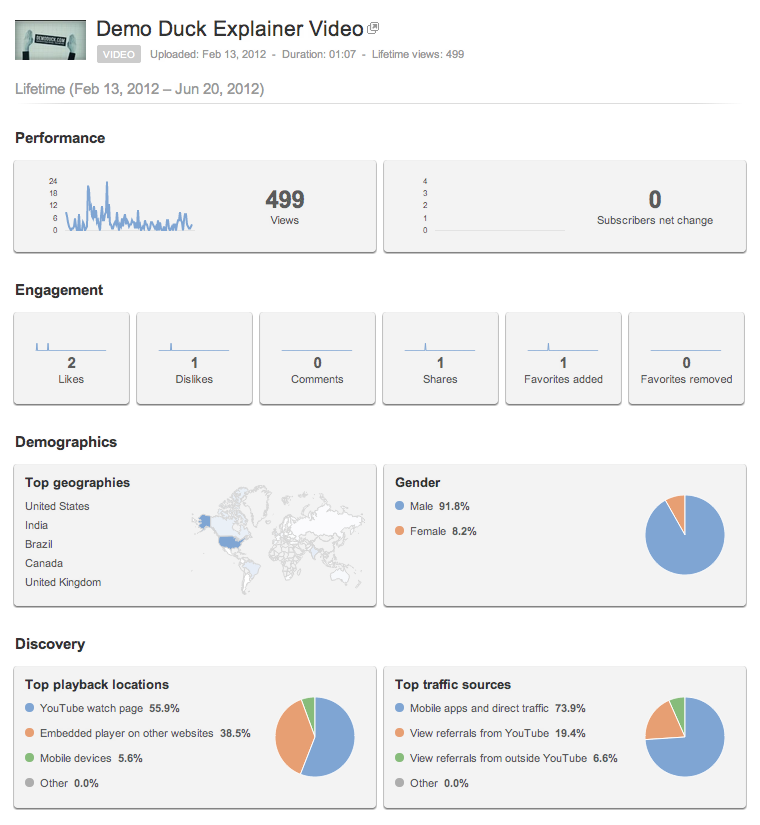
Video stats will help you keep track of how many people are watching your video, where they’re watching it (e.g. your website, YouTube, somewhere else), and the type of people watching it (e.g. gender, location). But for most people, knowing how many views your video has isn’t enough. It’s great to have a popular video, but the real question is whether or not the video is helping you achieve your business goals, which is where web analytics come in.

Website analytics can help you answer the important questions, like whether or not adding video to your website has increased time on site, page views, and/or conversions. Most of the time, the percentage change in conversion rate is what you’re really after (if you’re not sure what a conversion is, or how to setup goals and conversion in Google Analytics, make sure to read this article).
Step 3: Run the Numbers
Since we’ve always had a homepage video, we weren’t able to track how adding a video affected conversion rates, however, we were able to track video ROI and whether the new video we added increased or decreased conversions.
Here is the “old” video we had on our homepage (1.77% conversion rate):
Here is the “new” video (2.46% conversion rate):
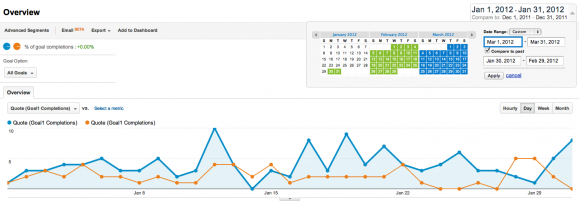
By comparing the 2 videos in Google Analytics, we were able to determine that the new video helped us increase our conversion rate (the number of visitors requesting a quote for a video) by 39%!

But 39% is just an impressive number with little meaning. By digging deeper (please stick with me here), I was able to come up with a pretty accurate estimate of how that 39% increase might affect our bottom line. Say we have 100,000 visitors to demoduck.com each year. If 2.46% are requesting a quote, that’s nearly 2,500 quote requests, or nearly 700 more quote requests than we would have otherwise received if we stuck with the old video.
If we have a close rate of 25%, that’s 175 additional videos that year. At an average of $5,000 per video, that’s an extra $875,000 in revenue. If the new video cost us $10,000 to produce, that’s a massive return on investment of 8,650%!
Some additional stats on the new video after being live for 17 weeks:
- The video has 4,500 plays (43% click play)
- The average viewer watches 72% of the video
- 58.2 hours of total video have been watched
A Few Extra Pointers
- When comparing conversion rates, try to compare similar time periods (e.g. January 2011 and January 2012). For example, if you compare a week in mid-January with the week before Christmas, you’re not likely to get an apples to apples comparison.
- Assuming you’re launching your video on an existing web page (like your homepage), try not to change any other page elements (like titles, content, layout, etc.). Additional changes to the page beyond the video will make it difficult to determine if the visitor behavior is affected by the video, or the other changes you made. As with any science experiment, it’s important to be consistent and test methodically!
- Don't forget that Google is also putting some videos at the top of search results, even those not published on YouTube, so if you've put you marketing animation video Wistia, see if you can track how it's showing up in those results too.
- For a head-to-head comparison, try using A/B split testing. With split testing, you can run two pages simultaneously (e.g. homepage A and homepage B). After selecting a conversion goal, Google will automatically track which version is performing better. Split testing is a great way to fine tune your web pages and maximize conversion rates.
Remember, producing an online video can be (and usually is) a great investment, but don’t just assume. Take the necessary steps to track the impact and understand your video ROI and how it is (or isn’t) helping you achieve your business goals.